Statistical modelling of spatial data

Analysis of Spatiotemporal Data

Poshan Niraula

2026-11-06

Big picture

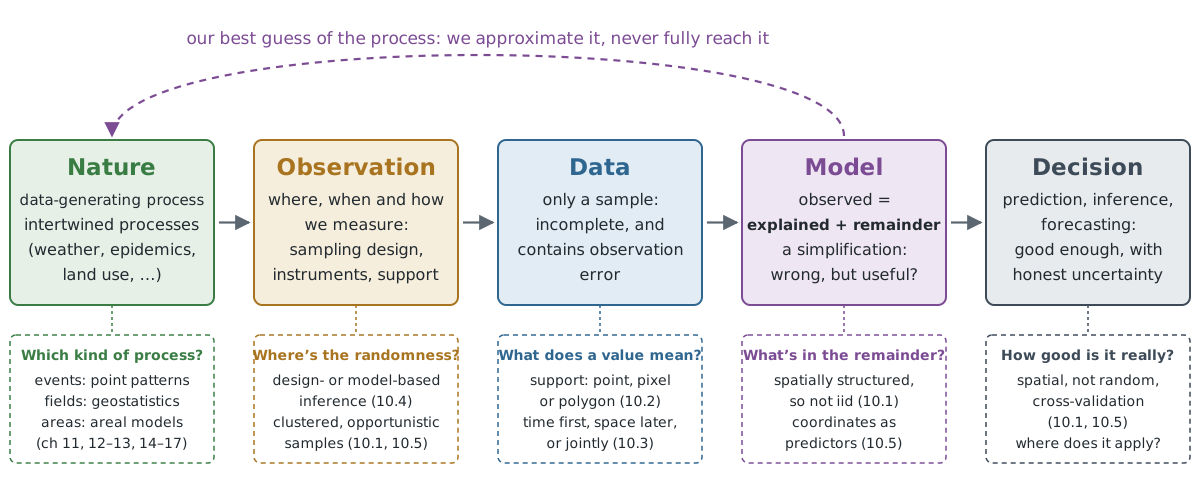
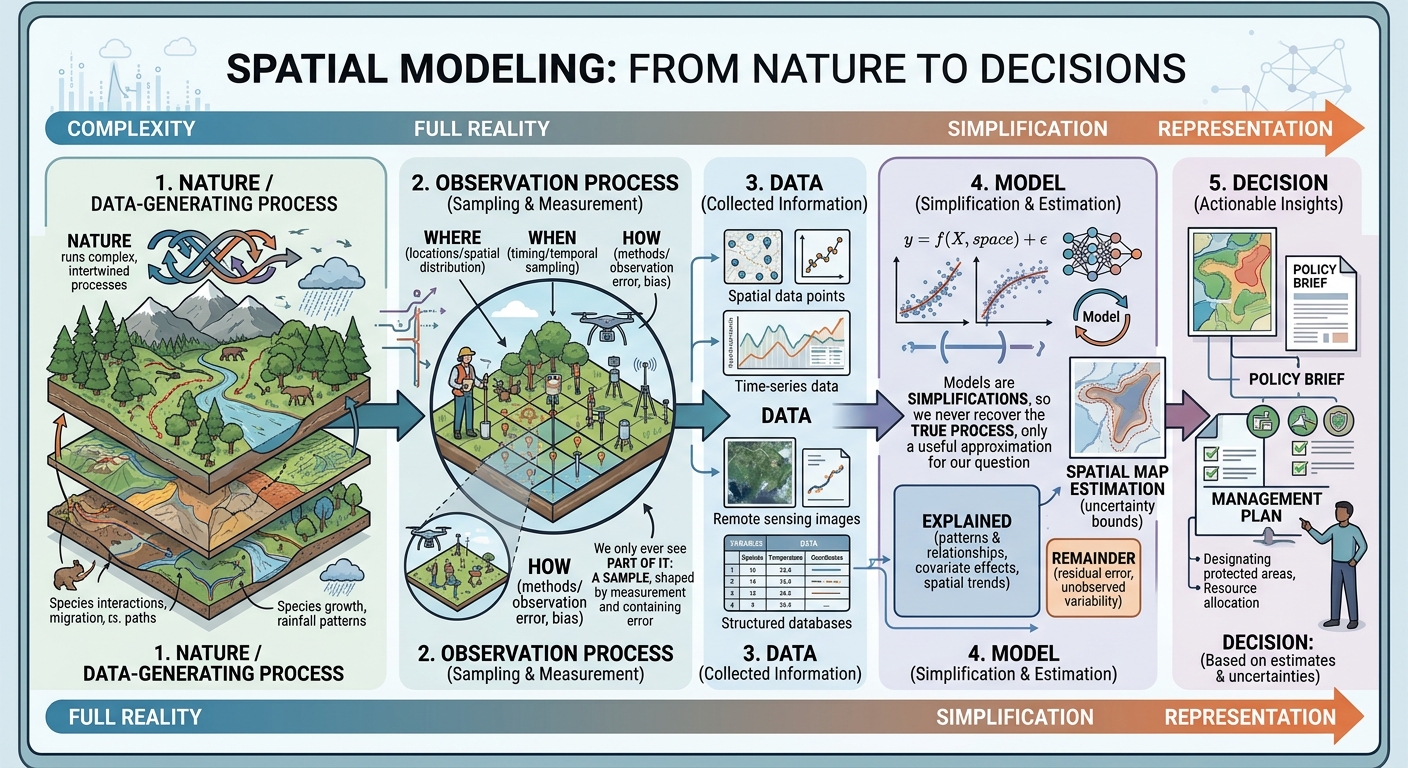
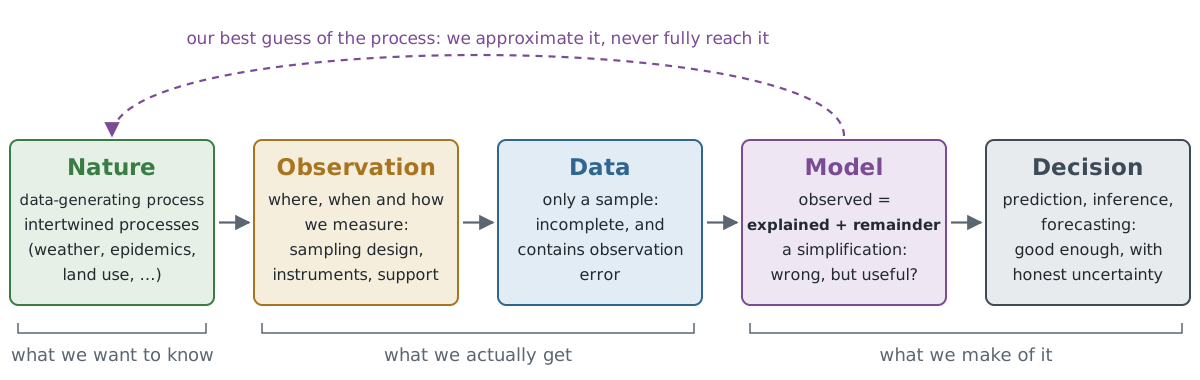
  • Nature runs complex, intertwined processes; when we describe them mathematically, we call this the data-generating process.
  • We only ever see part of it: a sample, shaped by where, when and how we measured, and containing observation error.
  • Our models are simplifications, so we never recover the true process, only a useful approximation for our question.

Big picture

Big picture: generated using Gemini

Big picture

Big picture: generated using Claude

Analysing

  • We analyse these samples to make inferences about the population,
  • or to find the data-generating process, or get closer to it.
  • In doing so, we:
    • quantify relationships between variables,
    • estimate population parameters, and
    • predict the outcome of observations that could have been taken but were not.

Model

  • Analysis is done by adopting a model for the data, e.g.

\[\text{observed} = \text{explained} + \text{remainder}\]

  • Explained: the part predicted by predictors or covariates (features in ML), e.g. with a regression model
  • Remainder: the variability that could not be explained
  • We may be interested in the relationship between the observed variable and the predictors, or in prediction

Example: flat rent = f(size, distance to the centre) + remainder

Model: facts

  • Models will be wrong: “All models are wrong, but some are useful” (George Box)
  • Choose the best of the wrong ones
  • Every model has uncertainty: in predictions, relationships, etc.
  • We want to be honest about these uncertainties and report them along with the results

Why the remainder matters

  • The explained part gives our best guess; the remainder tells us how much to trust it
  • Standard errors, p-values, confidence and prediction intervals all come from assumptions about the remainder
  • Standard regression: \(y = X\beta + \varepsilon\), with \(\varepsilon\) iid \(N(0, \sigma^2)\)
  • A pattern left in the remainder means the model missed something

Modelling for spatial data: the iid assumption

  • iid = independent and identically distributed
    • Independent: knowing one observation tells us nothing extra about another
    • Identically distributed: all observations come from the same distribution
  • Spatial data: nearby observations are similar (Tobler’s first law), and the mean often changes across space
  • Temporal data: today’s temperature tells us a lot about tomorrow’s
  • So we need methods that are specific to spatial and temporal data

IID or not

Which of these are (close to) iid?

  • Coin flips
  • Daily temperature in one city over a year
  • Rents of flats in one city
  • Lottery draws
  • NDVI of neighbouring pixels in one field

Modelling goals for spatial and spatiotemporal data

  • Predicting in space: predict a plausible value of a variable at some location, within the time span of the observations, and report the uncertainty
  • Relationship finding: scientific inference about the importance of covariates
  • Predicting in time: forecast the future at the same location

Modelling with non-spatial regression and ML models

  • Fitting / training: with predictors and observations
  • Predicting: with known predictors and unknown observations, which also gives a prediction error or interval

Modelling with non-spatial regression and ML models

library(dplyr)
library(sf)

## read file
system.file("gpkg/nc.gpkg", package = "sf") |>
    read_sf() -> nc

## create new variables
nc |> mutate(SID = SID74 / BIR74, NWB = NWBIR74 / BIR74, rate74 = SID74 / BIR74) -> nc1

lm(SID ~ NWB, nc1) |>
  predict(nc1, interval = "prediction") -> pr

bind_cols(nc, pr) |> names()
 [1] "AREA"      "PERIMETER" "CNTY_"     "CNTY_ID"   "NAME"      "FIPS"     
 [7] "FIPSNO"    "CRESS_ID"  "BIR74"     "SID74"     "NWBIR74"   "BIR79"    
[13] "SID79"     "NWBIR79"   "geom"      "fit"       "lwr"       "upr"      
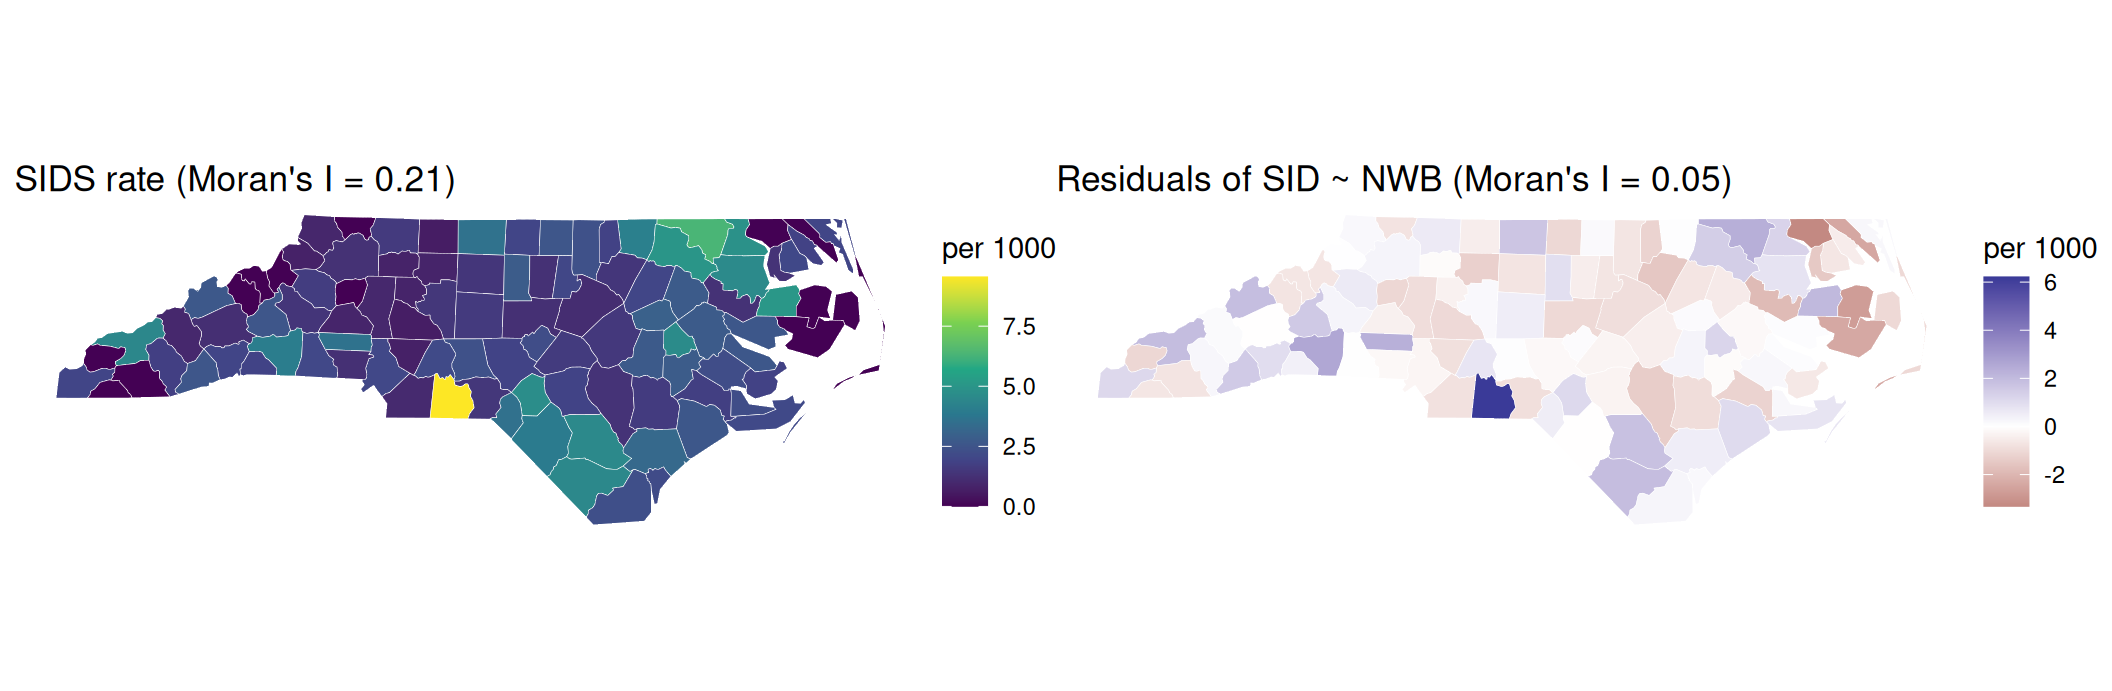
  • We generally fit the model on one part of the data and predict the remaining part, to see how well the model performs.

Is there a pattern left in the remainder?

  • Do neighbouring counties have similar values? Moran’s I near 0: no; larger: yes (details in ch. 14)

Model evaluation and comparison

  • How do we evaluate?

Model evaluation and comparison

  • Regression: RMSE, MAE, R²; classification: accuracy, kappa, ROC curve / AUC
  • Cross-validation (CV) in general assumes independent observations
  • Not suitable for spatial data with spatial autocorrelation and/or strong spatial clustering in the sample
  • R packages that replace naive CV: spatialsample, CAST, mlr3spatial, mlr3spatiotempcv (Python: e.g. GroupKFold with spatial blocks in scikit-learn)

Support and statistical modelling

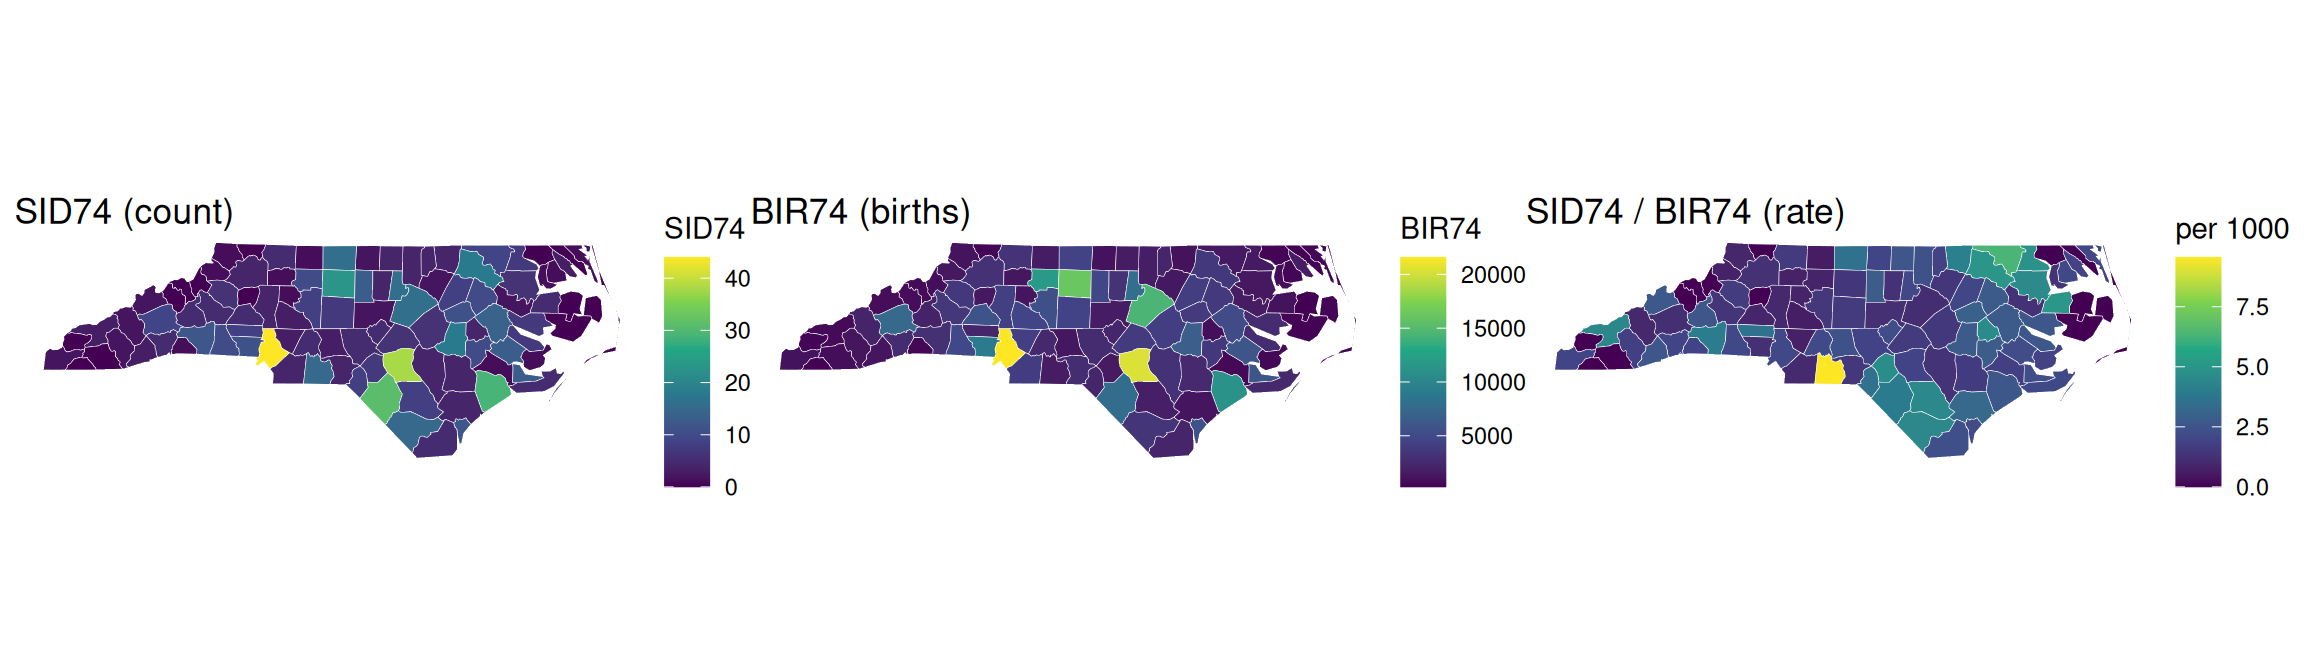
  • Extensive: adds up when areas are merged, splits when they are divided (population, number of cases, births)
  • Intensive: does not add up; merging gives a (weighted) average (density, rate, proportion, temperature)
  • Choropleths should show intensive variables; for counts use e.g. proportional symbols

Counts, births and rates

  • The count map is largely a births map: correlation between SID74 and BIR74 is 0.86

point support

Is the outcome of interest the location or the value?

Location → point patterns (ch. 11)

  • Where do events happen?
  • Needs all events in the observation window
  • e.g. crime, trees, wildfire ignitions

Value → geostatistics (ch. 12–13)

  • We choose the locations; the value measured there is the outcome
  • Comes from a field that exists everywhere
  • e.g. temperature, soil pH, NO₂
  • Marked point patterns (tree height, earthquake magnitude): do values between the points make sense? If not, it is not geostatistics.

Summary: support

Data Example: air quality and health Chapters
Points: events home locations of asthma cases 11
Points: a field NO₂ measured at monitoring stations 12–13
Areas asthma rates per district 14–17
  • The data type follows from how the data were collected and what we ask

Time in predictive models

Ways to handle time in spatiotemporal modelling:

  • Time first, space later: reduce time, then work on the problem spatially
    • e.g. hourly NO₂ at stations → annual means → interpolate a map (ch. 12)
  • Space first, time later: work spatially per time step, then analyse over time
    • e.g. classify a single scene (or scenes of one season), then compare land-use / land-cover change over several years
  • Jointly: model space and time together (ch. 13)

Design-based and model-based inference

Design-based

  • Randomness in location is assumed
  • Requires random sampling: every location has a known, positive probability of being included

Model-based

  • The locations are fixed: wherever we measured
  • Makes no assumption about how the samples were collected
  • Inference is only valid if the assumed model is valid

Which to choose?

  • Model-based framework:
    • predictions are required for individual locations, or for areas too small to be sampled
    • data were not collected with a random sampling scheme
  • Design-based framework:
    • observations were collected through a random sampling process
    • aggregated properties of the entire sampled region are needed
    • estimates are required that are not sensitive to model misspecification
  • If you can plan the sampling: sample randomly, it keeps both options open

Design-based: examples

  • Soil carbon reporting: total carbon stock of a farm or region for a climate report or carbon credits
  • Forest inventories: total timber volume or forest area of a country, from a randomly placed grid of field plots

Predictive models with coordinates

  • How about adding coordinates as features / predictors?
  • As with any predictor, choose methods that are not sensitive to shifts in origin or unit (scale)
    • origin: same places, different numbers (e.g. UTM false easting vs. a local grid)
    • unit: metres vs. kilometres
  • Linear models with an intercept and random forests are fine; distance-based methods (kNN) and penalised regression need standardised predictors

Predictive models with coordinates: rotation

  • When used as separate terms (x, y, x², y²), coordinates are sensitive to rotation of the axes (e.g. different projection systems)
  • Coordinates should be used jointly, not as separate features,
    • polynomials: include the cross term, e.g. \((x + y)^2\) instead of \(x^2 + y^2\)
    • GAMs: \(s(x, y)\) instead of \(s(x) + s(y)\)
    • random forests: split along the axes; adding rotated coordinates helps

Predictive models with coordinates

  • Can you think of a case where a single coordinate (lat or lon) works naturally in predictive modelling?

Ellipsoidal vs. projected coordinates

  • Small areas: projected and ellipsoidal coordinates give similar results
  • Larger areas: they differ more, and every projection distorts distances differently
  • Global models with polynomials or splines in lat/lon:
    • longitude wraps around: 179.9°E and 179.9°W are neighbours, but 360 apart as numbers
    • near the poles all longitudes meet: one degree of longitude is about 111 km at the equator and almost 0 at the poles
  • Use functions that are continuous on the sphere, e.g. spherical harmonics

Group discussion

  • Groups of 4
  • Pick one topic you find interesting; it can be an idea for your seminar project
  • 10 min discussing, then 10 min sharing
  • Write your answers in the shared document: here

Questions for your topic

  1. Question: what do you want to know? (one sentence)
  2. Support: what does one value stand for: a point, a pixel or an area? Over what time?
  3. Data type: events (point pattern), a field measured at points (geostatistics) or values per area (areal data)?
  4. Goal: prediction (a map, a forecast) or inference (understanding a relationship)?
  5. Data collection: random sampling or “whatever is available”? So design-based or model-based?

Bonus: which predictors would you use, and what could go wrong?

Need inspiration?

  • Urban heat on summer nights
  • Air quality (NO₂, particulate matter)
  • Bicycle accidents
  • Flood damage
  • Deforestation
  • Crop yield
  • Disease cases
  • House prices or rents
  • Wildfires
  • Species sightings

Example: urban heat

Question Example answer
Question Where is the city hottest on summer nights, and does green space help?
Support Temperature at a sensor (point), or a satellite pixel (e.g. 30 m to 1 km); hourly or nightly values
Data type A field measured at points: geostatistics (or pixels covering the whole city)
Goal Both: a map (prediction) and the effect of green space (inference)
Data collection Sensors placed where volunteers live: not random, so model-based
Bonus Predictors: green space, building density, distance to water. Risk: sensors cluster in some districts, so random CV looks too good

Sharing

  • Each group: your topic and your answers in one minute
  • Did two groups pick similar topics but different data types or supports?
  • Was anyone design-based?

Take-home messages

  1. A model = what we can explain + what is left over (the remainder)
  2. In spatial data, nearby values are similar, and so are their leftovers
  3. Similar observations carry less information than their number suggests: standard errors and random CV become too optimistic
  4. Random sampling: design-based; data from wherever we could get them: model-based
  5. Always ask: what does one value stand for (point, pixel or area)?

Summary

Big picture: generated using Claude

Next steps

  • Exercise: now
  • Next week: point pattern analysis (ch. 11)
  • Seminar project: aim and data, due before 13 Nov;

Exercise Time!

Exercise 1

 [1] "AREA"      "PERIMETER" "CNTY_"     "CNTY_ID"   "NAME"      "FIPS"     
 [7] "FIPSNO"    "CRESS_ID"  "BIR74"     "SID74"     "NWBIR74"   "BIR79"    
[13] "SID79"     "NWBIR79"   "geom"      "fit"       "lwr"       "upr"      
Exercise 3

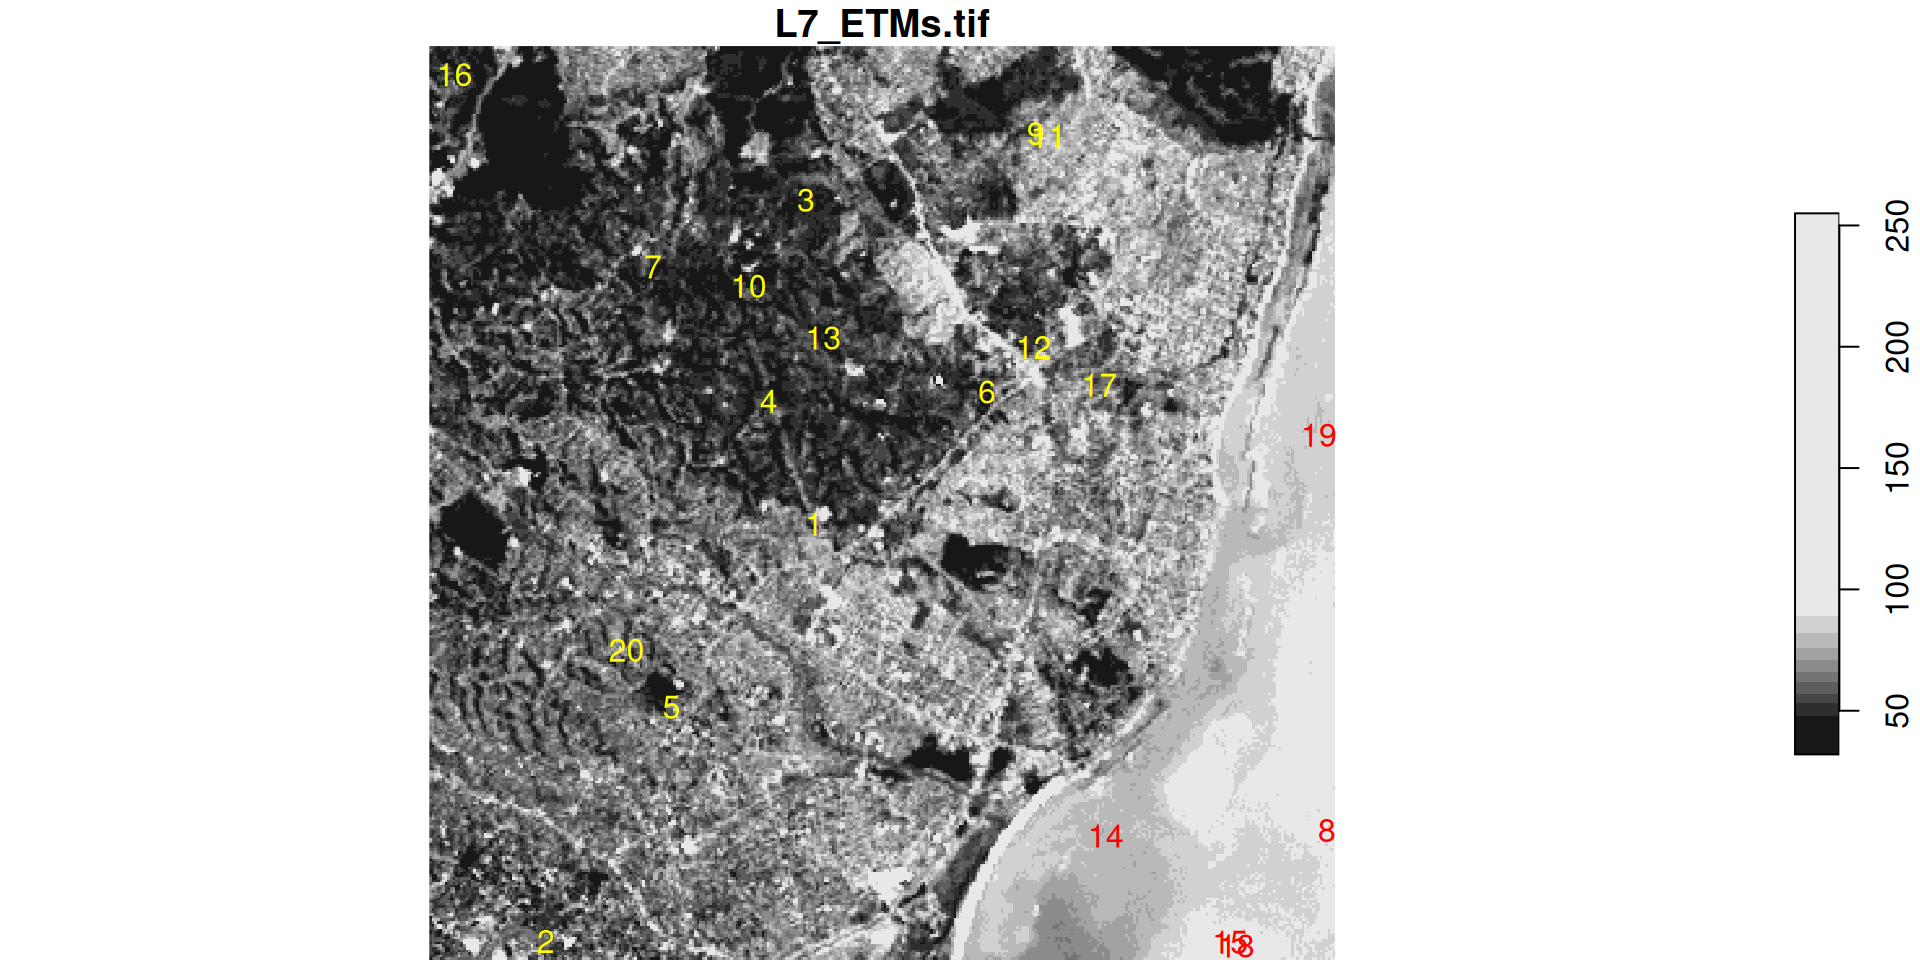
stars object with 3 dimensions and 1 attribute
attribute(s):
             Min. 1st Qu. Median     Mean 3rd Qu. Max.
L7_ETMs.tif     1      54     69 68.91242      86  255
dimension(s):
     from  to  offset delta                     refsys point x/y
x       1 349  288776  28.5 SIRGAS 2000 / UTM zone 25S FALSE [x]
y       1 352 9120761 -28.5 SIRGAS 2000 / UTM zone 25S FALSE [y]
band    1   6      NA    NA                         NA    NA    
stars object with 2 dimensions and 1 attribute
attribute(s):
             Min. 1st Qu. Median     Mean 3rd Qu. Max.
L7_ETMs.tif    12   41.75     63 60.95833    80.5  145
dimension(s):
         from to                     refsys point
geometry    1 20 SIRGAS 2000 / UTM zone 25S  TRUE
band        1  6                         NA    NA
                                                        values
geometry POINT (293002.2 9115516),...,POINT (290941.1 9114128)
band                                                      NULL
NULL

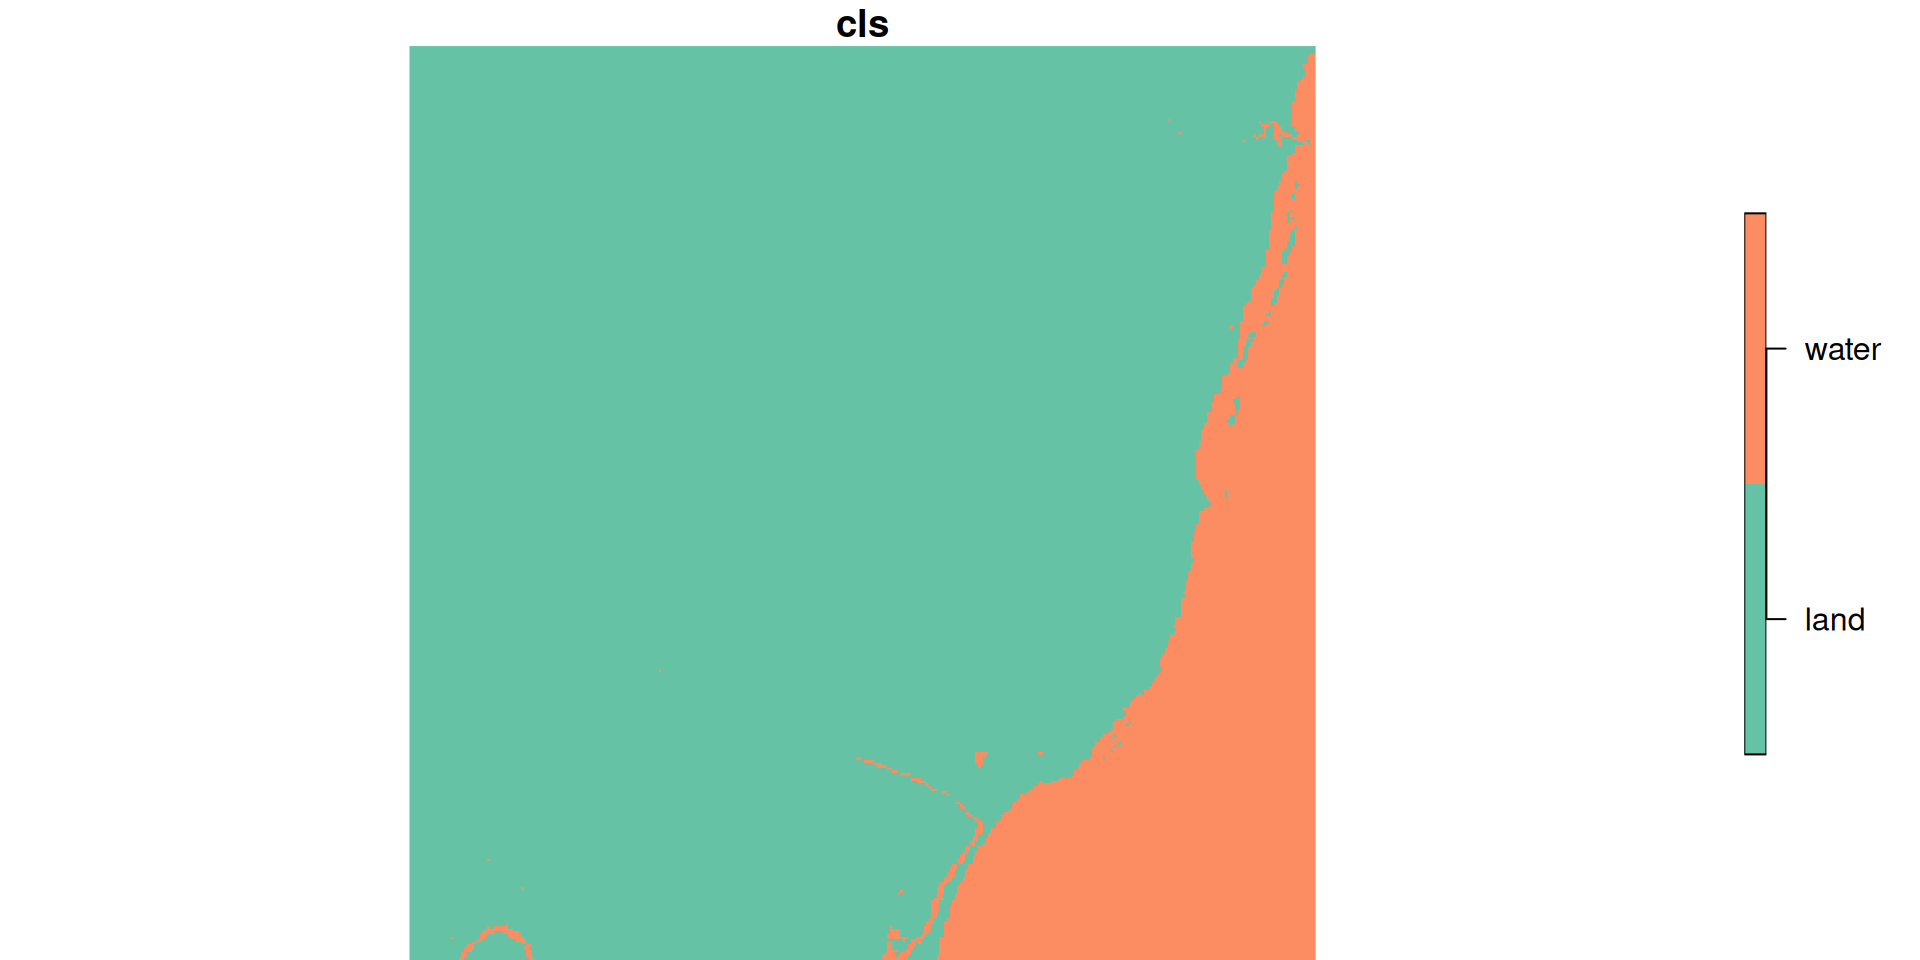
classification task